the mandelbrot set III
Previously, we learned about complex numbers and how to determine if a given complex number was part of the Mandelbrot Set
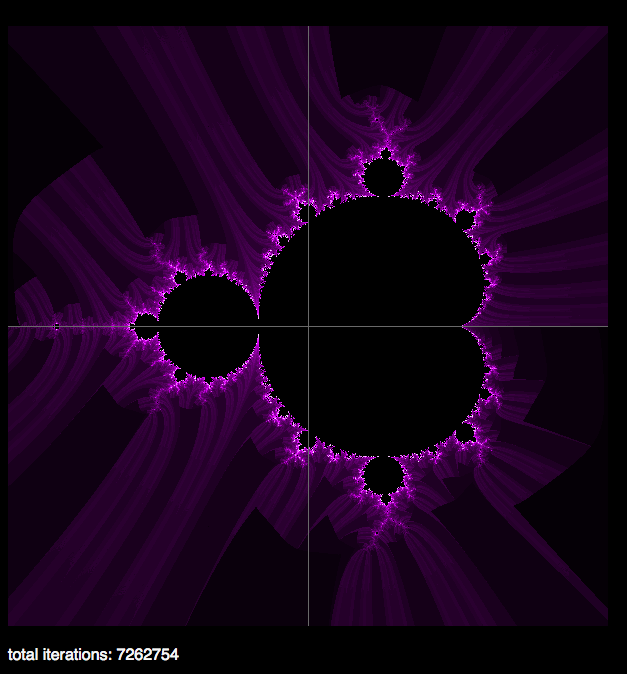
To finish the challenge we need to show a visual representation of the set.
Turns out I am more interested in calculating the set than I am in the display portion (not a surprise…as you can tell by quickly scanning the posts in this blog I have almost nothing about front end JavaScript, HTML or CSS). So I found a really great post by Ashraff Hathibelagal about using the HTML5 canvas element to display the results of the calculations.
So I used this visual implementation and combined it with my Object-Oriented JavaScript for calculating the set.
One big takeaway: by going with the Object-Oriented approach of creating a new ComplexNumber object and using custom prototype methods to make the calculations, there is a massive sacrifice of performance. If you clone the repo below and load up index.html in a browser the load time is pretty bad.
If instead I were to perform the calculations using only numbers, not doing an type conversions, the results would be much faster. And this makes sense. But for the purposes of this example I was more interested in learning about the actual calculations and how complex numbers work, so I am ok with this tradeoff.
The final results are here in a repo: https://github.com/lombardo-chcg/OOJS-Mandelbrot-Set
and here’s a screen shot: